Mapping the Dynamic Synaptome
Synapse-level imaging and analysis
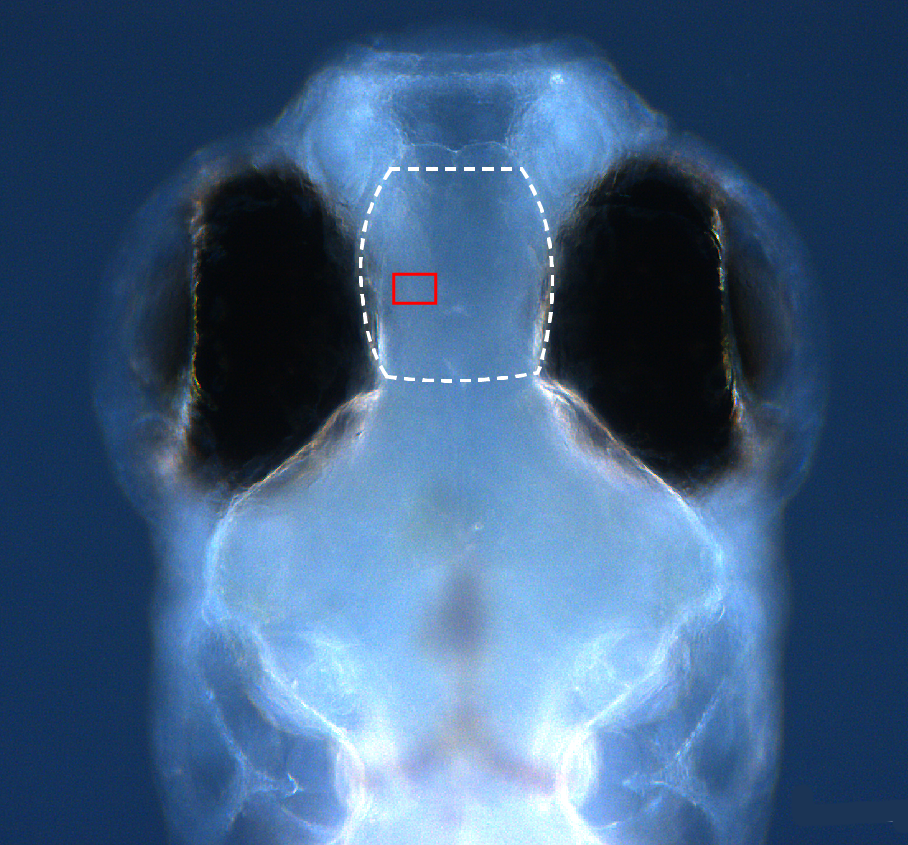
Dorsal view of a 15 dpf larval zebrafish pallium with region imaged by SPIM outlined in white from Extended Data Figure 4 (https://doi.org/10.25551/1/1-1Q60): Imaging labeled synapses using SPIM.
In 1894, Santiago Ramón y Cajal first suggested that memories are formed by changes in synaptic connections, a view that is widely held by neuroscientists. Over the last 50 years, studies have examined the changes in the structure of synapses in brain slices, but how synapses change in a living animal when a memory is formed is poorly understood. Here, we present data from experiments examining changes in the distributions of synapses in the brain of a larval zebrafish following associative memory formation.
We have developed and applied a set of tools that enables direct observation and spatial mapping of synapses using high-contrast selective plane illumination imaging of an endogenous postsynaptic density protein labeled with a recombinant GFP-coupled probe. Using these tools, we have observed changes in the microstructure of the pallium of larval zebrafish that occur during memory formation as a result of exposure to a novel classical conditioning paradigm that we developed. Surprisingly, we found that memory formation due to classical conditioning is associated with generation of new synapses, but not with systematic changes in the strengths of existing synapses.
Understanding how synapses change during learning could have broad implications. For example, better understanding of aberrant memory formation that can lead to post-traumatic stress disorder or addiction may one day lead to novel approaches for treatment of these conditions.
Our study was conducted such that all data, from the first experiment to these published results, was Findable, Accessible, Interoperable, and Reusable ( FAIR data principles). We were able to accomplish this by integrating the Deriva platform for scientific data management into our daily research activities. This approach enables an uncommonly high degree of transparency and reproducibility — each figure is directly supported by the data that went into its creation and all of the raw microscope data, analyzed data, human interpretation of these data, analysis programs, and essential research resources, are available here in the same structured, queryable, and downloadable form that was used to conduct the study.
Featured Data
- Complete Study Data
- All Public Data
- Main Results. Clicking on these links will take you to a figure and all data and code supporting
the figure:
- Altered activity in the anterolateral pallium of the larval zebrafish following tail flick conditioning (TFC), a robust classical conditioning paradigm.
- Experimental setup and analysis of tail-flick conditioning (TFC), a behavioral paradigm that stimulates associative memory formation in zebrafish larvae.
- Synapse changes with TFC in larval zebrafish.
- Phosphorylated ERK (pERK) staining shows increased anterolateral activity in learners exposed to the CS following training and in naïve fish exposed to the US.
- Regional differences in synapse formation in the pallium of learner fish.
- PSD-95.FingR-GFP localizes to synapses and its expression does not affect learning.
- Anatomical correlation of regions of increased neuronal activity and synaptic gain following TFC.
- Imaging labeled synapses using SPIM.
- An algorithm for semi-automated identification of synapses from raw SPIM data.
- Changes in synapse number for zebrafish exposed to control behavioral paradigms vs. TFC are not significant.
- Spines sampled within a 14-16 dpf zebrafish brain tend to move less than 4 µm in five hours.
- Feature based registration onto a template zebrafish brain.
- Distributions of lost and gained synapses in the pallium following TFC.
- Intensity of synaptic labeling does not change with TFC.
- Anterolateral cell population within the 14-16 dpf zebrafish brain projects out of the dorsal pallium compartment ventrally and posteriorly.
Overview of Synapse Data Model
The figure below shows the structure of the all of the data used to derive our results and the relationships between those data. Click on the text in the ovals to go to the different types of data. You can navigate to the connected elements from the location you select